In 2013 we were awarded a commission by Jerwood Open Forest, a partnership between Jerwood Charitable foundation and Forestry Commission England. For the commission we were invited to create a site-specific public sculpture which would be situated in the Alice Holt Forest in Hampshire a woods of oak and conifer trees, which supplied timber for the building of ships for the Royal Navy in the 18th and 19th centuries.
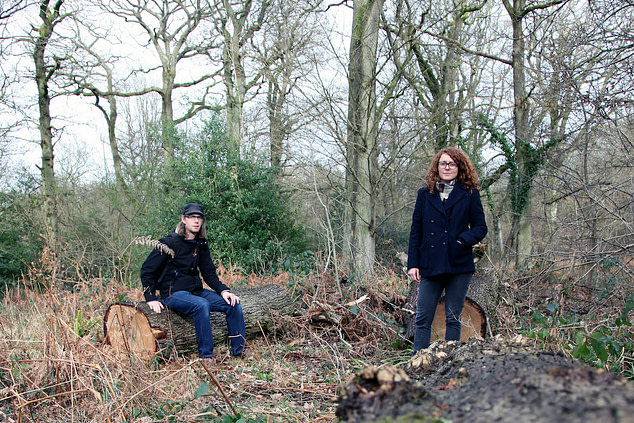
We began by finding out what science research projects were taking place in the forests of England that we could develop some ideas around for a new work. This initial research, and discussions with the forestry commission team, lead us to learn about an Experimental Forest nearby where scientists have a 28m tall tower that takes measurements from the forest canopy. We learnt that a scientist based near there at Forest Research, Matt Wilkinson, was using some of the scientific instruments we came across in our initial proposal, so we were excited when we found out that he was up for meeting with us.
![]()
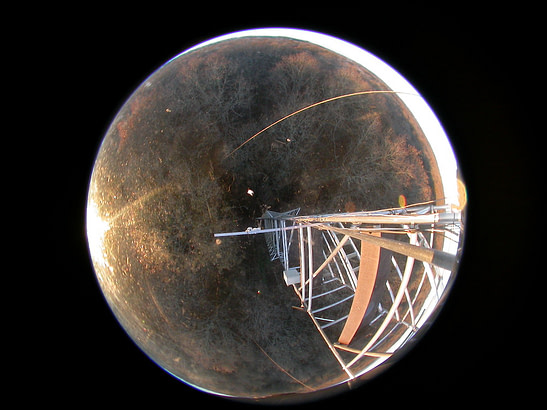
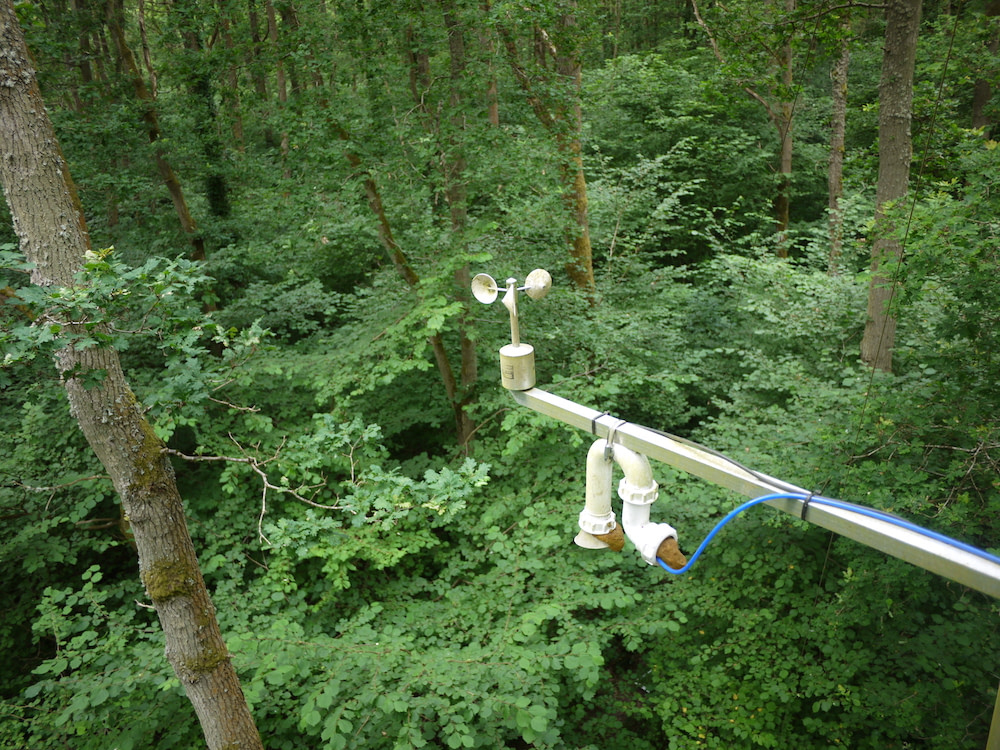
The tower is located in the ‘Straits Enclosure’ and takes 4 measurements: wind, temperature, H2O, carbon take up and loss by trees. There are also two cameras which collect images of the canopy from above and below.
At the top of the tower, there is a great sense of serenity, and an incredible view over the expanse of trees; we noticed how different the sounds were up there. During this trip we learnt a lot about the various instruments and how the data is collected and stored. The scientists plot diurnal and annual cycles, noting when the forest is a source of CO2 and when it acts as a sink for CO2. Matt told us that the trees sink more carbon dioxide in the day and become a strong source of CO2 in the night, with the trees taking up more carbon dioxide in the summer, and being a strong source of CO2 in the winter.
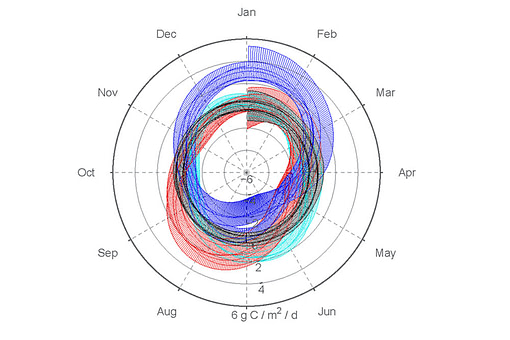
After our visit to the woods we had some discussions with fabricators (Millimetre) about what materials we could use to create the sculpture. Meanwhile we carried out some research around the visualisation techniques scientists in this field use to plot their data. Matt Wilkinson pointed us to some work his extended network produced, and one of the graphs for carbon dioxide plotting caught our attention. It uses a polar plot to represent several years’ worth of data overlaid. This type of data naturally comes encoded with markers of time; we are always exploring different ways to represent time beyond the linear so we liked the way that time was represented as a cyclical form, mirroring the shape of a tree trunk and tree rings within the waveforms. This particular diagram sparked something for us.
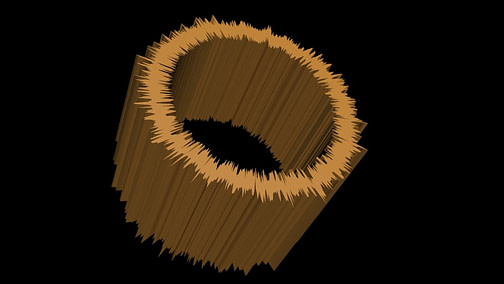
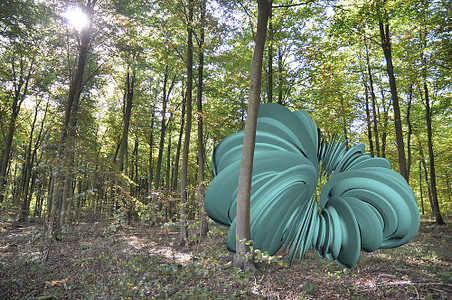
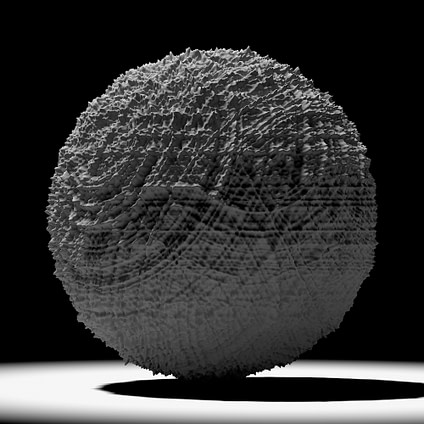
We settle on an approach to use the year’s worth of data from the forest, mapped in a circle. We then started thinking about the data sets (the measurements of the CO2 exchange between the forest and the environment, wind velocity, temperature and moisture) as a sculptural medium and how we can ‘sculpt’ the data. We start with a circular strip of pure data, as a waveform; a beautiful 3-d object directly taken from the data. We then use this to make a range of test models for lathing the forms, extruding them; We root our thinking in what would work in the real world, in a forest, wanting to find a form which doesn’t seem too familiar or comfortable.
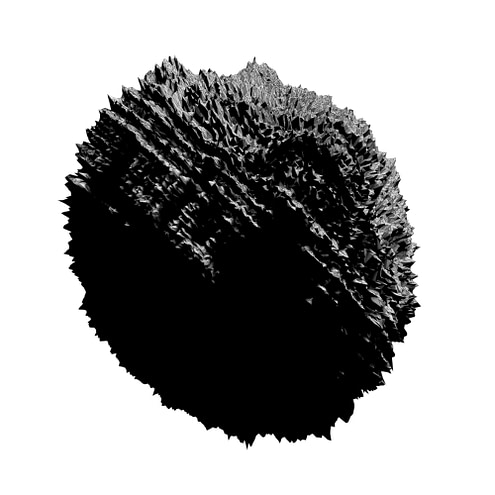
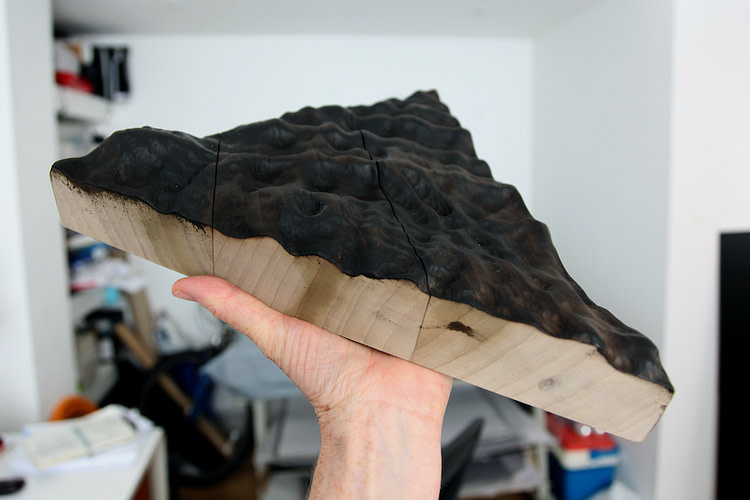
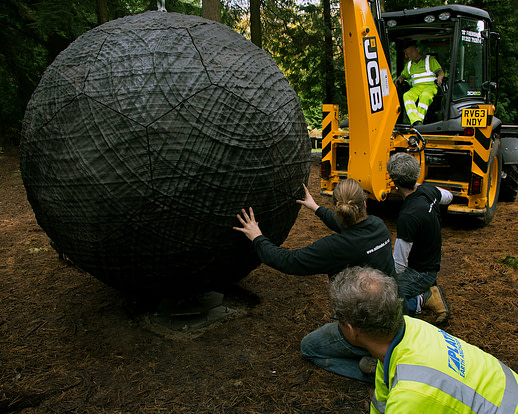
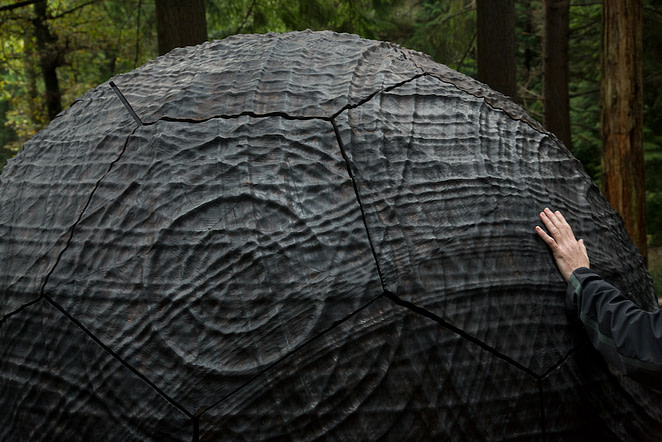
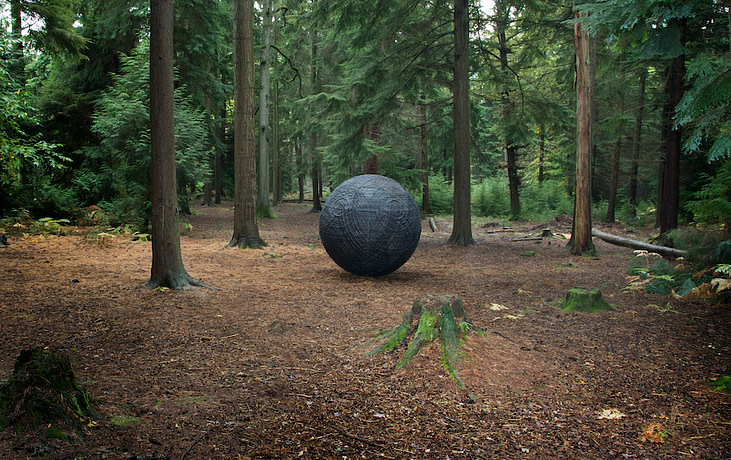
We start to translate the data, not just as waveforms but as 3-D objects. Out of these experiments came a ‘big dark globe’ that’s burnt all over: using charred wood, which has been shaped using a layering of the data sets. This approach creates something visceral from the data; something tangible rather than just a graphical representation of it. We re-visited Matt Wilkinson, looking over our ideas with him. He was able to share with us a years’ worth of data for each of the four instruments, which we would then layer to create the interference patterns across the surface of the final sculpture.
We also were able to access a year’s worth of image data from the hemispherical cameras imaging the canopy and forest floor. This imagery we found totally absorbing, showing the slow process of the changing seasons beautifully. This imagery was also revealing of the anomalies of the capturing process, which give the material a raw quality making you aware of the mechanics of the data collecting. This material later became part of an exhibition at Jerwood Projects space.
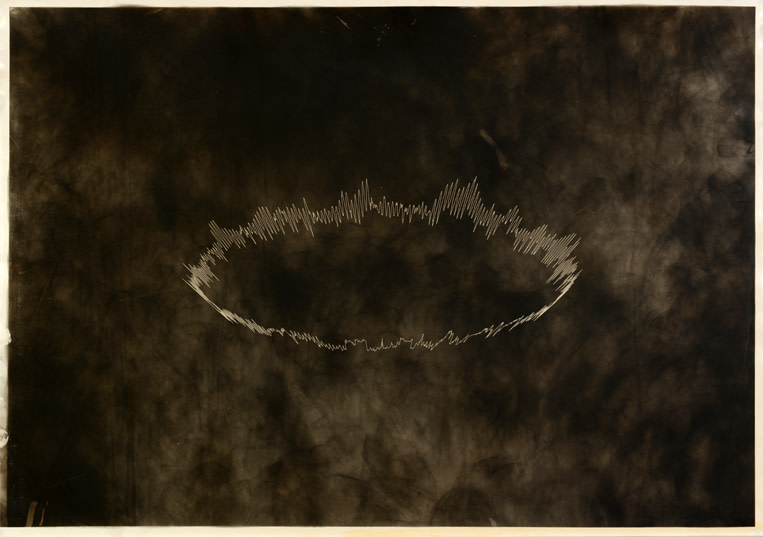
We also did some tests exploring making drawings using the data collected from flux tower, by carbonising paper and scratching into this with a computer plotter.
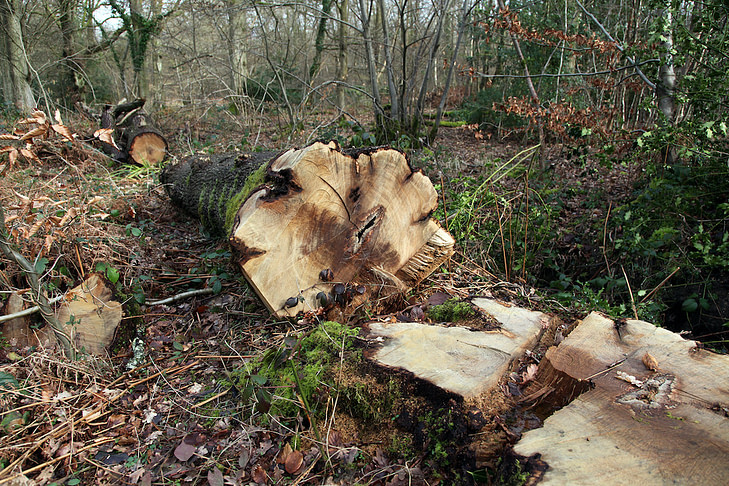
We spent some time looking into what wood we could use for constructing the outdoor sculpture, from fallen trees from the research forest to off-the-shelf wooden planks, gaining an understanding of what properties the wood would need being exposed to the elements. Weighing-up budget, durability and the timeframe of the project we decided on using wood from a local timber suppliers.
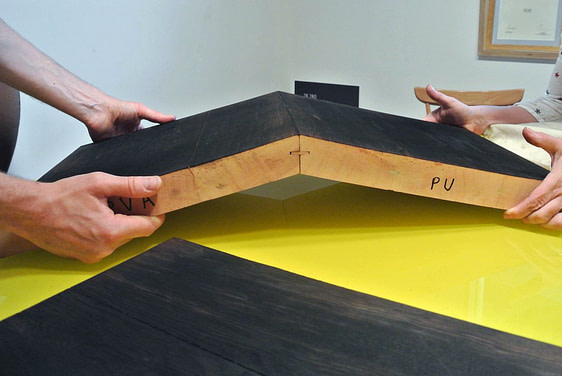
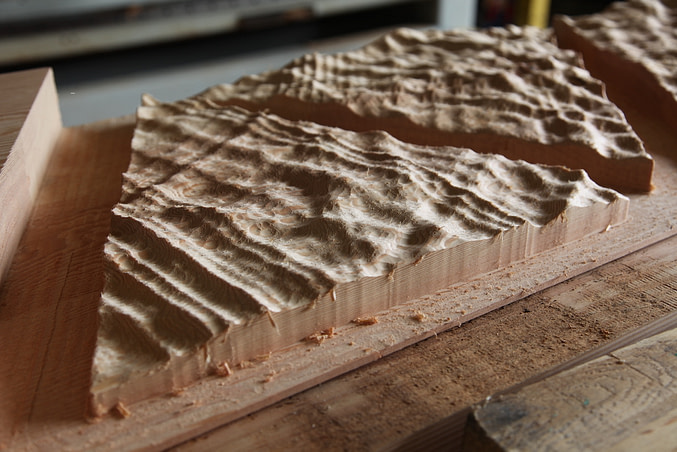
We worked closely with the fabricators, supplying the datasets as 3D instructions for a 3d CNC cutter. This result was a surface carved of complex interference patterns produced by the waveforms and patterns in the data. We also worked with programmer Julian Weaver to develop custom digital techniques to translate the data from strings of numbers into three-dimensional forms. To find the right surface finish for the work millimetre carried out charring wood tests. The final structure being formed from a series of interlocking pentagons and hexagons, with undulations carved upon the surfaces which reveal the patterns inherent in the data.
While the work was in production we worked closely with the team at the Forestry Commission to find a location for the sculpture to be sited. We looked at a number of sites with an understanding of the technical requirements of the installation of the work. We spent some time thinking about this, wanting the exact site to be somewhere people would happen across unexpectedly, and not that close to the entrance so if you came intentionally to find the work it would be an adventure to discover its location.
Once the work was installed it had this incredible sense of belonging; like it was born of the forest, which it was in many ways, shaped by the data which represents the elements vital to the growth of trees and the sustaining of the forest. We chose to call the work Cosmos, defined as a complete, orderly, harmonious system; with reference to the sources of the combined data which are so delicately balanced in order for the forest to exist, an incredible interdependent ecosystem.
