artworks

Residency with Planet Disk Connection Group and DJCAD, University of Dundee, Scotland (2019-2021)

Spectral image data

Over a period of 2 years, from 2019-2021 we were artists in residence with the Planet Disk Connection Group, University of Dundee, Scotland. We visited and met with scientists  whose research explores planet formation environments, and carried out research at our studio.

University of Dundee, Physics Building

As well as trying to absorb the overall scientific and technological approach, we filtered areas of specific personal interest; the methods used to capture light from distant stars, the processes it goes through via layers of physical translation, the data that is produced, what the data can tell us and how the team employed time in their observations. In our artworks we’re interested in creating experiences of the matter being studied framed through the scientific and technological devices that are used to study it. We do this to not only explore the capacity of humankind to create an understanding of the physical world but to reflect on our place in it. We were interested in the processes, tools and devices used to study the matter as much as the matter itself.

Aurora Sicilia Aguilar, University of Dundee researcher in star formation and protoplanetary disks


credit: John Lightfoot


We spent time with the PDCG researchers, absorbing their modes of working, particular areas of interest and inquiry. This sketch which
Aurora Sicilia Aguilar (University of Dundee researcher in star formation and protoplanetary disks) used in one of her presentations, became one of the touchstones for our early research. It shows how ‘shadows cast by material very close to a star can be projected onto the surrounding nebula as if it were a giant screen’, we are shown a ‘view from Earth’ and a ‘side view’ from some position in space. This idea of  viewpoint is something we are always fascinated by, how we are bound by our physical positioning on planet Earth rotating around the Sun, or by our sensory limitations in only being able to see a portion of light waves for example. We reflect on how these impact our everyday experiences of the physical world, this often involves stepping outside of ourselves and intentionally entering a space of unknowing.

A painting of La Silla, European Space Observatory, Chile, under the southern sky by the Chilean artist Nemesio Anthunesz, on the request of the Swedish Natural Science Research Council.

In our studio back in Brighton we researched the science and technologies behind spectroscopy and more specifically the spectroscopic instruments whose data the scientists analyse in their research. These include the HARPS and FEROS spectroscopes, located at La Silla Observatory, Chile. (We were due to visit these in November 2019 for another project, which was quite serendipitous, but it was unfortunately cancelled due to the Chile uprising.) It’s quite easy to access all the hardware and technical documents once you start searching and they’re invaluable for getting a thorough understanding.

Spectral type colour chart


In our studio, Brighton, UK


Spectral image data

Our research took us down many paths, including looking into waveguides, prisms and optics, ways of guiding, dispersing and projecting light. We like to thoroughly pick apart the scientific and technical process as part of our research, not only to get a good understanding of the subject we are working with, but to have a good handle on the raw materials to build with, from the ground up. This way we can draw together multiple strands in an intuitive way informed by the research.


The Fiber-fed Extended Range Optical Spectrograph (FEROS) credit: ESO. The Fiber-fed Extended Range Optical Spectrograph (FEROS) was originally installed on the ESO 1.52-metre telescope in 1998. After this telescope was decommissioned, FEROS was moved to the MPG/ESO 2.2-metre telescope, where it had first light in 2002.


We explored the European Space Observatory (ESO) data archives, accessing and learning about the spectrograph data from a wide range of ESO spectroscopes. This involved trawling through archives and learning about the different techniques for presenting spectroscopic information collected of light from forming stars and planets, as visual data.

We created a log of observatories, instruments, calibration processes, spectrograph techniques and targets used by Dundee.

Image credit: ESO
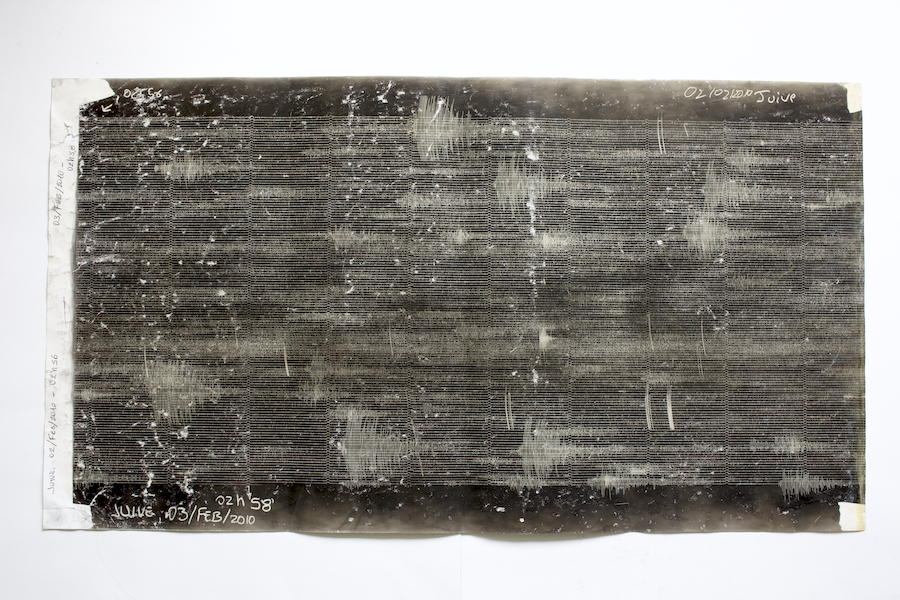
Spectrograph of target Ex LUPI taken by the SINFONI (Spectrograph for Integral Observations in the Near Infrared) instrument at the European Space Observatory, Chile. Each instrument collates the dispersed light in a differing visual configuration, which lays the capturing process bare.


Justyn Campbell White’s (post-doctoral researcher, Astrophysics, University of Dundee) office / spectral wave data Image credit: Semiconductor

Post-doctoral researcher Justyn Campbell White took us through spectral numerical data; what it is, how it exists and how we can access it. We learnt about the software he’s creating to compare information from the same target over periods of time, this is the key to resolving information about structures around young stars. The waveform plots flux or light intensity over light wave.

Model of the ESO 3.6-m Telescope with transparent dome.


Plane plot made in Topcat using processed data

In the studio we accessed numerical waveform data for different targets and instruments and comparing, to get a good understanding of it. We gathered materials, data and techniques to experiment with, considering the numerical data as a way to bring time into the process, using the flux to give rhythm.

To create Spectral Constellations, the work which evolved from this residency, we employed animation software which we can realise in real-time. This new software was quite different to the software we had used previously, which was laborious and time-consuming, requiring the rendering animations, it’s more immediate and lent itself to a feeling closer to sculpting light, with instant results to programming and manipulation. Our practice always sees us pushing the technology we use to learn its limitations and find a space where our own language can emerge. Into this software we introduced some of the emission line data we collected during our research to see what it brought to the table both physically and conceptually. We also played with introducing other external materials which guide and manipulate the light based on the capturing techniques scientists employ to study light emissions.

This photo shows the ESO 1.52-m telescope, installed since almost 30 years in its dome at the La Silla observatory in the southern Atacama desert. The new FEROS spectrograph is placed in an adjacent, thermally and humidity controlled room in the telescope building (where a classical coudé spectrograph was formerly located). The light is guided from the telescope to the spectrograph by 14-m long optical fibres.

The STAR-MELT paper that the scientists have written on the software they have developed to study emission lines of young stellar objects was accepted for publishing while we were on our residency. This helped consolidate and reinforce our research, focusing in on what’s important in their endeavour and describing the technicalities of how they work with the data they collect. It also introduced a new way of working with the data over time. This paper becomes instrumental in setting our direction of investigating the spectral data as a physical material to work with – light and time in the form of animation.

The residency culminated in the creation of a three LED panel artwork. The LEDs display generative animations, driven by scientific data of young stars. Taking the Spectroscopy data of gas and dust structures around distant young stars, which comes together to form planets. 

We worked directly with Spectral data from the European Space Observatory archive (http://archive.eso.org/

You can read more about Spectral Constellations here.

Spectral Constellations, 2022


Spectral Constellations (still), 2021


FEAT (Future Emerging Art and Technology) Residency (2016)

Lenses used to study the quantum behaviour of atoms, University of Oxford lab

In 2016 we were invited to be artists-in residence with QuProcs (Quantum Probes for Quantum Systems) a joint research project between a number of international labs. 

We made research trips to three of these: the Clarendon Laboratory at Oxford University, the Computational and Quantum Optics Group at Strathclyde University in Scotland and the Quantum Lab at University of Turku in Helsinki.

Strathclyde University Lab


University of Oxford lab wall

Supported by Professor Sabrina Maniscalco we arranged meetings with the teams at each of the labs, and undertook our own research to get to grips with the whys and hows of what the scientists were doing.

Meeting scientists Turku University

It is always quite overwhelming and exhausting jumping in the deep end in this way, spending an intensive period taking on lots of new information that you don’t fully comprehend, but we have found it is actually key to how we work. Engaging directly with the scientists rather than learning from the written page enables you to get the bigger picture, experience how the science functions in the lab and gives opportunities to delve into specific areas of interest and build up relationships with the scientists. All of this becomes integral to our process of making an artwork when engaging with scientific settings. 

University of Oxford imaging of an optical lattice

One of the key experiments carried out by QuProcs at Strathclyde University involves attempting to look at individual atoms trapped with light to understand better the problems of solid state physics. By using lasers the scientists trap atoms in an ‘optical lattice’ just like the crystal in a semiconductor, the lattice mimics atoms in real world materials. This process allows the quantum behaviour of atoms to be studied. Atom sources, which are metal in atomic form, are heated up to a vapour, and then cooled and pushed, as a beam, through stages of cooling, to get to very low temperatures. The low temperatures enable the scientists to see the atoms isolated to observe their quantum behaviour. 

The scientists described the experiment as starting with a system which is settled, and then disturbing it, shaking it, removing one particle in the middle, then taking images in time intervals which reveal something about the quantum behaviour of particles.

University of Oxford, view through an infrared viewer

We were interested to hear the researchers speaking about different kinds of ‘image capturing’. They described two types of image: Fluorescing the image, which consists of collecting the photons emitted by the atoms, and the data is the matrix with intensity. The other technique, absorption imaging, is the inverse, where you image the absence of light. You take two pictures, one with the atoms and one where you shine light onto the atoms. You collect what comes through and in effect you get a picture of atom shadows. 

One of the key bits of learning from these conversations and our time in the QuProcs labs was the principle that complexity arises from the build-up of particles when studying their individual interactions on a microscopic scale. That new unpredictable phenomena emerge (Sabrina Maniscalc, Oxford). 

As Andrew Daley told us ‘a lot of the most exciting discoveries with physics have not been discoveries from suddenly seeing that something is fundamentally different about the microscopic, they were things about how particles behave when there’s many of them –  their collective behaviour – a behaviour that you couldn’t predict even if you knew very well how things behave microscopically.’

University of Oxford lab, lenses for directing lasers to create ‘optical lattice’

The first person to describe this on a philosophical level was physicist Philip Anderson, in his editorial in Popular Mechanics, More Is Different: Broken symmetry and the nature of the hierarchical structure of science, (4 Aug 1972, Vol 177, Issue 4047 https://www.science.org/doi/10.1126/science.177.4047.393)

Andrew goes on to explain ..when we start investigating what was happening in particular condensed matter, the physics of electrons and solids, we started to discover that even if you could write down a microscopic model for how nature in principle worked , it did not mean that you would immediately understand all the properties that came out of that. 

As soon as you started to do physics on a scale where you had more particles involved, it was not enough to know these microscopic models, it was almost like a new science completely unto itself to understand what was happening. 

Strathclyde University


Oxford University lab

In the past we have spent time in science laboratories with very large fields of interest. For this project it was great to gain insight into a more specific area of research. It enabled us to carry out in-depth research in the area and get a thorough understanding of the science being carried out, with a clear overview of the experiments, simulations and theories being explored. 

Strathclyde University, research scientists desk

When starting our residency some of the scientists were initially unsure about what we might want from them, this was partly due to none of the labs having previously had artists visiting. At one lab a scientist opened up to us at a dinner saying he hadn’t been interested in meeting the visiting artists, but that after we had spent some time with him talking about his work he found it really enjoyable and beneficial to him, helping him to consider his work in a new way. 

Meeting scientists Turku University

Following two days spent at the Turku lab in Finland discussing with the theorists in groups, what they do and the fundamentals of their work, Sabrina said that several scientists had told her they really enjoyed talking to us in this way as they don’t get to talk to each other like that normally; for them it opened up new ways of engaging with each other. Receiving this feedback from scientists during our residencies helps us reflect upon our role as artists and to get a better understanding of what we can bring to science settings as well as what we can take away to help us develop new work and concepts.

Anton Buyskikh mathematical simulation

After the initial research trips and the independent research we carried out we narrowed our focus upon the mathematical simulations produced at the Strathclyde lab by Anton Buyskikh. Anton was kind enough to send us files, images and data to further our research and experiments. We then set to work developing a computer generated animation with mathematical quantum system simulations as a starting point, considering what they represent and how the language of science represents it.

Parting the Waves exhibited as part of Semiconductor: The Technological Sublime, City Gallery Wellington, New Zealand, 2019

The residency resulted in the creation of a new moving image work Parting the Waves, you can read more about this here.

Residency at CERN, the European Laboratory for Particle Physics (2015)

Aerial view of part of CERN campus

During our three months residency at CERN we took time to explore every nook of the vast site, we learnt so much about the history of CERN this way and connected with people we wouldn’t have ordinarily crossed paths with. There’s a tower we sneaked into to get a good view of part of the main campus.

Theorist Luis Alvarez Gaume, our scientific partner during our residency at CERN

Luis Alvarez Gaume is a theorist and was our scientific partner. We had our weekly therapy sessions with him where he would turn the physical laws of the universe, as we knew them, on their head and constantly pull the rug from under our feet. He kept us on our toes, and you can hear him dissecting science and scales of human experience in our work The View from Nowhere.

CERN scientists John Ellis

John Ellis guided us on our explorations into theories around The Standard Model. He was kind and generous allowing us to fumble our way around the complex world they inhabit. He too is in the View from Nowhere

In one of the workshops at CERN

We asked to have a tour of the workshop. They’re creating prototype parts for various experiments employing incredible skill and time-consuming processes to nudge and force metal into various forms and structures. It became clear that at CERN they are pushing the envelope at every level, operating at the limits of human endeavours, both technologically and empirically. Here we are at the workshop where they learnt to ignore us over the couple of weeks we filmed in there.

Inside building 180 at CERN

In building 180 we bore witness to the sheer scale CERN is working at, these limits of human endeavour, what surprised us was how the language of theory, essentially mathematics came to be the creative, malleable and playful language whereas the real world materials of technology were hard and fixed and difficult to move and control. We played with this contrast in our moving image work The View from Nowhere.

Building 180

Discussion taking place in the theory department at CERN

Hanging out in the theory department we couldn’t aim to understand their discussions but tried to absorb their methods, interactions, languages and endeavours.

ATLAS experiment, CERN


In the CERN archive with Anita Hollier

Anita Hollier welcomed our request to visit the archive and have a poke around.

The archive holds collections of past scientists’ physical notebooks and paperwork.

Bubble Chamber photograph, in the archive, showing a ‘looper’ moving through the instrument.

Bubble Chamber activity photograph, in the archive.

Bubble Chamber photograph, in the archive.

In the archive we went looking for evidence of the human signature in the capturing process.

Working in our temporary studio at CERN

This is an ATLAS data image in Root. Beginnings of thinking about ATLAS data and how we might be able to work with it / access it / in what way we would work with it of thinking about HALO.

ATLAS data used to make HALO


Visualisation of HALO, which is a kinetic artwork created using particle collision data collected through the ATLAS experiment at CERN

As a result of our residency we were given the opportunity to propose a large-scale idea for Audemars Piguet Commission at Art Basel.


Arts at CERN: https://arts.cern
CERN: https://home.cern
ATLAS experiment: https://atlas.cern
Experimental Particle Physics Research Group, University of Sussex: https://www.sussex.ac.uk/epp/research/aod

Jerwood Open Forest (2013-2014)

Water Vapour detector, Flux Tower

In 2013 we were awarded a commission by Jerwood Open Forest, a partnership between Jerwood Charitable foundation and Forestry Commission England. For the commission we were invited to create a site-specific public sculpture which would be situated in the Alice Holt Forest in Hampshire a woods of oak and conifer trees, which supplied timber for the building of ships for the Royal Navy in the 18th and 19th centuries. 

At Alice Holt Forest, 2013

We began by finding out what science research projects were taking place in the forests of England that we could develop some ideas around for a new work. This initial research, and discussions with the forestry commission team, lead us to learn about an Experimental Forest nearby where scientists have a 28m tall tower that takes measurements from the forest canopy. We learnt that a scientist based near there at Forest Research, Matt Wilkinson, was using some of the scientific instruments we came across in our initial proposal, so we were excited when we found out that he was up for meeting with us. 


The tower is located in the ‘Straits Enclosure’ and takes 4 measurements: wind, temperature, H2O, carbon take up and loss by trees. There are also two cameras which collect images of the canopy from above and below. 


At the top of the tower, there is a great sense of serenity, and an incredible view over the expanse of trees; we noticed how different the sounds were up there. During this trip we learnt a lot about the various instruments and how the data is collected and stored. The scientists plot diurnal and annual cycles, noting when the forest is a source of CO2 and when it acts as a sink for CO2. Matt told us that the trees sink more carbon dioxide in the day and become a strong source of CO2 in the night, with the trees taking up more carbon dioxide in the summer, and being a strong source of CO2 in the winter.

Polar plot graph showing measurements of the take up and loss of carbon dioxide from the forest trees, collected from the top of the Flux Tower

After our visit to the woods we had some discussions with fabricators (Millimetre) about what materials we could use to create the sculpture. Meanwhile we carried out some research around the visualisation techniques scientists in this field use to plot their data. Matt Wilkinson pointed us to some work his extended network produced, and one of the graphs for carbon dioxide plotting caught our attention. It uses a polar plot to represent several years’ worth of data overlaid. This type of data naturally comes encoded with markers of time; we are always exploring different ways to represent time beyond the linear so we liked the way that time was represented as a cyclical form, mirroring the shape of a tree trunk and tree rings within the waveforms. This particular diagram sparked something for us.

CO2 data ring 3D visualisation, sketch

We settle on an approach to use the year’s worth of data from the forest, mapped in a circle. We then started thinking about the data sets (the measurements of the CO2 exchange between the forest and the environment, wind velocity, temperature and moisture) as a sculptural medium and how we can ‘sculpt’ the data. We start with a circular strip of pure data, as a waveform; a beautiful 3-d object directly taken from the data. We then use this to make a range of test models for lathing the forms, extruding them;  We root our thinking in what would work in the real world, in a forest, wanting to find a form which doesn’t seem too familiar or comfortable.

Data rings lathe model, sketch

We start to translate the data, not just as waveforms but as 3-D objects. Out of these experiments came a ‘big dark globe’ that’s burnt all over: using charred wood, which has been shaped using a layering of the data sets. This approach creates something visceral from the data; something tangible rather than just a graphical representation of it. We re-visited Matt Wilkinson, looking over our ideas with him.  He was able to share with us a years’ worth of data for each of the four instruments, which we would then layer to create the interference patterns across the surface of the final sculpture.

Sketch for final sculpture

We also were able to access a year’s worth of image data from the hemispherical cameras imaging the canopy and forest floor. This imagery we found totally absorbing, showing the slow process of the changing seasons beautifully. This imagery was also revealing of the anomalies of the capturing process, which give the material a raw quality making you aware of the mechanics of the data collecting. This material later became part of an exhibition at Jerwood Projects space. 

Hemispherical camera capture

We also did some tests exploring making drawings using the data collected from flux tower, by carbonising paper and scratching into this with a computer plotter. 

365 days of data, 2013


150 year old fallen oak tree

We spent some time looking into what wood we could use for constructing the outdoor sculpture, from fallen trees from the research forest to off-the-shelf wooden planks, gaining an understanding of what properties the wood would need being exposed to the elements. Weighing-up budget, durability and the timeframe of the project we decided on using wood from a local timber suppliers.

3D sketch for final sculpture

We worked closely with the fabricators, supplying the datasets as 3D instructions for a 3d CNC cutter. This result was a surface carved of complex interference patterns produced by the waveforms and patterns in the data. We also worked with programmer Julian Weaver to develop custom digital techniques to translate the data from strings of numbers into three-dimensional forms. To find the right surface finish for the work millimetre carried out charring wood tests. The final structure being formed from a series of interlocking pentagons and hexagons, with undulations carved upon the surfaces which reveal the patterns inherent in the data. 

Material finishing tests


Forest data – CO2 take up and loss, water vapour, wind and temperature – translated as interlacing relief patterns


CNC sample

While the work was in production we worked closely with the team at the Forestry Commission to find a location for the sculpture to be sited. We looked at a number of sites with an understanding of the technical requirements of the installation of the work. We spent some time thinking about this, wanting the exact site to be somewhere people would happen across unexpectedly, and not that close to the entrance so if you came intentionally to find the work it would be an adventure to discover its location. 

Installing Cosmos, Alice Holt Forest


Cosmos, 2014

Once the work was installed it had this incredible sense of belonging; like it was born of the forest, which it was in many ways, shaped by the data which represents the elements vital to the growth of trees and the sustaining of the forest. We chose to call the work Cosmos, defined as a complete, orderly, harmonious system; with reference to the sources of the combined data which are so delicately balanced in order for the forest to exist, an incredible interdependent ecosystem.

Cosmos, Alice Holt Forest, 2014

Smithsonian Artist Research Fellowship
Mineral Sciences Laboratory
Smithsonian Institution National Museum of Natural History (2010)

Materials Processing Lab. at the Mineral Sciences Laboratory, Smithsonian National Museum of Natural History

We had spotted the materials processing lab on the Mineral Science Laboratories website and were keen to try and spend some time there, meeting scientists and researching and observing how they create an understanding of the physical origins of earthly matter. We applied to SARF (Smithsonian Artist Research Fellowship) and then had to convince the scientists they should welcome artists into the lab.

Smithsonian National Museum of Natural History celebrating 100 years

The scientists in the mineral science laboratory had a vote on whether to invite artists in, after a few months of us being there we were invited to be in the 100 years photo, as we “had earned the right to be there”.


Geologist Bill Melson

We were in the lab every day, getting to know the people, collections, and their wider networks. A major subject of Bill Melson’s research was dedicated to listening to Arenal volcanoe, developing a vocabulary to document the sounds a volcano makes and see if it can help predict eruptions. He has a fascinating written and audio archive observing Arenal volcano in Costa Rica, we helped him to digitise some of his reel-to-reel audio recordings which also feature in Worlds in the Making.

Bill Melson’s volcano language

Mineralogist Jeff Post

Jeff Post has a deep understanding of the structure of mineral crystals and how and why they form the way they do. You can hear him describing these processes in our work Where Shapes Come From.

Volcanologist Rick Wunderman

There were several people who took us under their wing, one of them was volcanologist Rick Wunderman. His door was always open to us and like several others his kindness and generosity extended beyond the lab and our research endeavors.

Semiconductor residency log

On residencies and fieldwork trips we always keep a daily log of research and activities…”Asked Dick if he would read out some of his research notes, he said yeah!”

Sorena Sorenson and her Cathode Luminescence Imager

Sorena Sorenson let us lose on her Cathode Luminescence Imager. We spent many a evening locked in the lab creating time lapse animations of glowing mineral crystals.

Image captured by Semiconductor using the Cathode Luminescence Imager.


Ruth and scientist Roy Clarke in the Special Books library at Smithsonian National Museum of Natural History.

In the special books library with scientist Roy Clarke. He taught us about the Widmannstatten structure within meteorites.

Widmannstatten structure ‘nature print’

Joe in the rock collection at the Mineral Sciences Laboratory, Smithsonian National Museum of Natural History

We had free reign to explore the rock collection.

Rock collection, Fulgurites

Sample in the mineral collection

Sample from the mineral collection

Materials Processing Lab


Mineral Sciences Laboratory library

Volcano film archive, Mineral Sciences Laboratory

Volcano film archive waiting to be transferred. Scientists have been depositing their 16 mm films taken of volcanoes with the Smithsonian since the 1920’s! We helped advise on transferring them and they feature in our work Volcano Observatory.

Jonathan and Linda Weisenbach.

We had been patiently waiting for a meteor to be sliced so we could film the process, the time had arrived!

Mike Wise, Geologist at Mineral Sciences Lab

We worked our way round the laboratory meeting all the scientists.

Scientist Dick Fiske

We spent many hours filming Dick Fiske processing his lava samples from Hawaii, for our work Worlds in the Making.

Ruth in the meteorites collection

In the office provided to artists on the Smithsonian residency


Mineral slice

Exploring by bike


Exploring the meteorite collection


Mineral crystal in the Smithsonian collection


Mineral crystal in the Smithsonian collection

Smithsonian Artists Research Fellowship: https://www.si.edu/sarf
Smithsonian National Museum of Natural History: https://naturalhistory.si.edu/research/mineral-sciences
Smithsonian Mineral Sciences Research: https://naturalhistory.si.edu/research/mineral-sciences/research
Smithsonian Institution: https://www.si.edu

Gulbenkian Galapagos Artists’ Residency (2010)


In 2010 we went to the Galapagos Islands and mainland Ecuador as part of the Gulbenkian Galapagos Artist residency. We were developing an artwork which explores how humans observe, document and create an understanding of the origins of the physical world around us and we had been looking for an opportunity to visit volcanic landscapes and observe volcanologists, we were lucky to be offered this residency along with a Smithsonian Artist Research Fellowship at the Mineral Sciences Laboratory in the Smithsonian National Museum of Natural History later the same year. This research, explorations and filming became our artwork Worlds in the Making.


‘Sagitta’, the boat which took us around the Galapagos Islands

The residency involved spending 7 days on a boat with a Galapagos natural history guide, who took us to many of the Galapagos Islands to learn about the landscapes, animals, history of and environmental approach to the Galapagos Archipelago.


Golden rays in the waters of the Galapagos Islands


Heading up Volcan Chico

We stayed in Isla Isabela for a week and trekked up to volcanic landscapes at Volcan Chico and to the old Sulphur Mines, to film them.

Filming at the Sulphur Mines, Volcan Azufre

Filming at the old sulphur mines on Volcan Azufre, which appears in our work Worlds in the Making. Volcanologist Dick Fiske from the Mineral Sciences Lab can also be heard reading a description of a scientists exploration to, and study of, the sulphur mines at Volcan Azufre, which we found in the Charles Darwin Research Station Library (see below).

Volcan Azufre – sulphur mine science paper 1973

The library was a fascinating resource, every scientist who came to study on the Galapagos Islands were obliged to donate the scientific papers from their research conducted there.

Volcan Azufre


Charles Darwin Research station on the Island of Santa Cruz

We spent a week at the Charles Darwin Research station on the Island of Santa Cruz. Visiting scientists stay here to carry out studies into wide ranging subjects from invasive marine species to the restoration of ecosystems.


Scientists on the Galapagos Islands collecting data on the invasive blackberry

We spent a day with Jorge and his team, filming his processes of collecting data on the invasive blackberry. This became our work Indefatigable.

Seismometer at Quito University monitoring seismic activity of the Tungurahua Volcano.

Back on mainland Ecuador we had arranged to meet volcanologists at the University of Quito.

Images of Volcano Tungurahua, Ecuador

At the University of Quito we learned about one of the sites we would visit, the Volcano Observatory in Banos where they observe the active Volcano Tungurahua, you can see a drawing of it in this image.

View from Volcano Observatory towards Tungurahua (obscured by clouds!)

They use a mix of digital and analogue methods to study Tungurahua including this make shift technique for estimating the height of the volcanic plume in kilometres.

View of Tungurahua


Picture of seismograph

The scientist’s hand-make carbon paper for their seismographs, they taught us how to do it. They like using paper seismographs as they can hear when the needle frantically scratches the paper alerting them to an eruption.

Rancho Ojos del Volcan

During our time in Banos we spent a few nights in this hut, opposite the volcano, the clouds rarely cleared for any decent filming but the whole building would shake with the boom of eruptions.

Flier for impromptu screening in Banos, Ecuador

During our couple of weeks in Banos, the host where we were staying decided to organise a screening of our artworks at the only place in town which owned a projector. It was an incredible experience, a mixture of locals of all ages and tourists including some teenagers from a local village who would attend a computer club on a Saturday morning to access digital tools for making work. We talked about the works in English, someone would translate into Spanish and there would be all sorts of questions flying around, we remember it as a highly charged excitable affair, we hope we inspired.


The local village of Volcano

The University of Quito also sent us on trip with their engineers for a few days, who were mending one of the seismic stations. We were under falling ash and the camera lens became crunchy.

We visited Cotopaxi, the world’s highest active volcano. You must climatise to the height before attempting to climb it. We made it to the snow line. Others we were staying with made an overnight trek to the top which sounded pretty harrowing, it was incredibly windy.

Cotopaxi


Climbing Cotopaxi


Cycling back after walking up Cotopaxi, an active volcano in the Andes Mountains, located in Latacunga city, Ecuador


Lichen Rock, Ecuador

Galapagos Residency Publication: https://gulbenkian.pt/uk-branch/publication/galapagos/
Calouste Gulbenkian Foundation: https://gulbenkian.pt/uk-branch/
Article on Semiconductor’s Galapagos residency: https://gulbenkian.pt/uk-branch/gulbenkian-galapagos-artists-residency/
Galapagos Conservation Trust: https://galapagosconservation.org.uk

Arts Council England International Fellowship: Art and Space Science at UC Berkeley Space Sciences Lab (2005-2006)

Todd Hoeksema, solar physicist, Stanford Solar Observatory

In 2005 we were awarded the ACE international fellowship to spend 5 months at the UC Berkeley Space Sciences Laboratory, California, USA. We ended up spending six months there initially, as there was so much to do, and we were thoroughly immersed. We went back in 2006 to interview and photograph for our moving image work Magnetic Movie. Returning in 2014 to say hi.

Scientist’s office at Space Sciences Laboratory, University of California, Berkeley

Forest Mozer, Physicist, Space Sciences Laboratory, University of California, Berkeley

Forest Mozer (above) took us under his wing after we gave a presentation to him and his colleagues, a room full of rocket scientists! He gave us tours of the laboratory and introduced us to his fellow scientists who worked across the field of planetary, solar and interplanetary magnetic fields. This sowed the seed for our journey and the research route we would take.

One of the five satellites that make up THEMIS in a clean lab at the Space Sciences Laboratory

SSL was our first residency in a science laboratory. We were in the lab everyday exploring, researching and interviewing. Space scientists take actual measurements from satellites which they design, build, capture data from and analyse. They do all of this at SSL and we started to gain an insight into how in science all the different roles from experimenters to theorists to engineers come together to realise one goal. Here they are working on one of the five satellites that make up THEMIS.

Janet Luhmann, Solar Physicist,  Space Sciences Laboratory , University of California, Berkeley

Solar physicist Janet Luhmann challenged us to question science as a human invention and as a result she inspired us to ask more philosophical questions of science, which filters through all of our work today. In Magnetic Movie she talks about hairy balls and sausages on the Sun.

A sample of Aerogel the lightest solid in the world, at SSL

The Wilcox Solar Observatory, Stanford University, California

We went to Wilcox Solar Observatory at Stanford University, and learnt about how they have been collecting daily observations of the Sun’s global magnetic field since 1975 with the goal of understanding changes in the Sun and how those changes affect the Earth.

David Brains images of magnetic fields on Mars

Experimenting during the development of Magnetic Movie at Space Sciences Laboratory, University of California, Berkeley

The top image above shows David Brain’s images of magnetic fields on Mars. They were made using actual data collected by a magnetometer orbiting Mars. Scientists can learn about magnetic fields on Mars and their anomalies. This visual language, where the fields are represented using colour coded lines, inspired the beginnings of Magnetic Movie. You can hear David Brain in Magnetic Movie talking about what it would look like if you could see Mars’s magnetic fields.

Ruth’s desk at SSL (above) the colourful tabs are playing with the visual language scientists have developed to convey information about magnetic fields. These experiments led on to what became Magnetic Movie.

Stephen Mende, Senior Research Scientist, Space Sciences Laboratory, University of California, Berkeley

Stephen Mende would talk to us about the Aurora Borealis. That is his thing, and he describes it in Magnetic Movie. There’s a great picture of him in a book called Majestic Lights, as a student huddled up in the red cabin you can see in a photo on his desk, collecting data.

Iain Hannah and Stephen Christie, post doctoral researchers at Space Sciences Laboratory of the University of California, Berkeley, who we worked with to access the archival images of the sun

After seeing an unusual image of the Sun on a scientists wall and a bit of research post doc researchers Iain Hannah and Stephen Christie taught us how to access archives and download scientific images of the Sun, taken by satellites and ground based observatories, in differing wavelengths. The beginnings of Brilliant Noise was born.

One of the 100,000’s of images of the sun, taken by a satellite as a single snapshot that we used when creating Brilliant Noise [add link]

NASA Goddard Space Flight Centre

During our time at SSL, they sent us off to other NASA ‘bases’ we visited NASA Ames and NASA Goddard Space Flight Centre.

Ilan Roth, Physicist Space Sciences Laboratory, University of California, Berkeley and Ruth

Prelinger Library, San Francisco, California – research beyond the lab


Yosemite National Park, California – exploring the local areas on foot and bike

Yosemite National Park, California

View from SSL over San Francisco Bay

The premiere of Brilliant Noise at Recombinant Media Labs, San Francisco, following our residency at SSL

Berkeley Space Sciences Laboratory: https://vcresearch.berkeley.edu/research-unit/space-sciences-laboratory
The wilcox solar observatory: http://wso.stanford.edu
NASA Ames Research Centre: https://www.nasa.gov/ames
NASA Goddard Space Flight Centre: https://www.nasa.gov/goddard